This is the course notes I took when studying Introduction to Financial Accounting, offered by Wharton on Coursera.
Accounting is a system for recording information about business transactions to provide summary statements of a company’s financial position and performance to users who require such information.
Most companies keep three sets of books:
- Financial accounting: standardized reports for external stakeholders (and what we’ll focus in this course);
- Tax accounting: IRS rules for computing taxes payable;
- Managerial accounting: custom reports for internal decision making.
In US, financial reporting requirements are regulated by the SEC:
- 10-K: Annual report
- 10-Q: Quarterly report
- 8-K: Current report (material events)
They must be prepared in accordance with Generally Accepted Accounting Principles (GAAP). Most countries with a stock market have similar requirements. Strictly speaking, these requirements are only applicable for public companies. But banks and venture capitals require such documents from private companies for loans and investments, so they become applicable to most companies.
GAAP rules are established by delegating from US Congress -> the SEC -> Financial Account Standards Board (FASB). International Financial Reporting Standards (IFRS) are established by the IASB and are required in over 100 countries. There is a high degree of overlap in the two standards.
Management of a company is responsible for preparing financial statements. The statements are audited by the Audit Committee of the Board of Directors (provides oversight of management’s process) and external auditors (hired by the Board to “express an opinion” about whether the statements are prepared in conformity with GAAP). The SEC and other regulators take action against the firm if any violations of GAAP or other rules are found, and information intermediaries (stock analysts, institutional investors, the media) may expose or flee firms with questionable accounting.
The required financial statements are
- Balance sheet: financial position (listing of resources and obligations) on a specific date;
- Income Statement: results of operations over a period of time using accrual accounting (i.e., recognition tied to business activities);
- Statement of Cash Flows: sources and uses of cash over a period of time;
- Statement of Stockholders’ Equity: changes in stockholders’ equity over a period of time.
Statement of Cash Flows reports cash transactions over a period of time, with the following categories:
- Operating Activities, transactions related to the provision of goods or services and other normal business activities, such as wages;
- Investing Activities, transactions related to the acquisition or disposal of long-lived productive assets, such as machinery;
- Financing Activities, transactions related to owners or creditors.
Income statement reports results of operations over a period of time using accrual accounting:
- Revenues are increases in “owners’ equity” from providing goods or services;
- Expenses are decreases in “owners’ equity” incurred in the process of generating revenues;
- Net Income (or Earnings or Net Profit) = Revenues - Expenses. Note that Net Income does not equal to change in cash.
Balance sheet reports financial position (resources and obligations) on a specific date.
- Assets are resources owned by a business that are expected to provide future economic benefits;
- Liabilities are claims on assets by “creditors” (non-owners such as debtors) that represent an obligation to make future payment of cash, goods, or services;
- Stockholders’ Equity (Owners’ Equity) are claims on assets by owners of business. It consists of Contributed Capital (arises from sale of shares) and Retained Earnings (arises from operations).
Balance Sheet Equation
Balance sheet equation, or the accounting identity, is Asset = Liabilities + Stockholders’ equity. Put it plainly, it means resources equal to claims on resources by outsiders (liabilities) and owners (stockholders’ equity). Key features of balance sheet equations are
- Must always balance! (Double-entry bookkeeping)
- Changes over a period between two Balance Sheets are summarized in the Income Statement, Statement of Stockholders’ Equity and Statement of Cash Flows. Specifically, assets are cash and noncash assets, and change in cash is the Statement of Cash Flows. Stockholders’s equity is Contributed Capital and Retained Earnings, and the change in Contributed Capital is the Statement of Stockholders’ Equity and change in Retained Earnings is the Income Statement.
If we put all components of balance sheet equation together,
\[\begin{align}\begin{aligned} \text{Assets}=&\text{Liabilities}+\text{Stockholders' Liability} \\ \text{Stockholders' Liability}=&\text{Contributed Capital} + \text{Retained Earnings} \\ \text{Retained Earnings} =& \text{Prior Retained Earnings} + \text{Net Income} - \text{Dividends} \\ \text{Net Income} =& \text{Revenues} - \text{Expenses} \end{aligned}\end{align}\]We get the complete balance sheet equation:
\[\begin{align}\begin{aligned} \text{Assets} =& \text{Liabilities} + \text{Contributed Capital} + \text{Prior Retained Earnings} \\ +& \text{Revenues} - \text{Expenses} - \text{Dividends} \end{aligned}\end{align}\]Asset
An asset is a resource that is expected to provide future economic benefits (i.e. generate future cash inflows or reduce future cash outflows). An asset is recognized when:
- It is acquired in a past transaction or exchange;
- The value of its future benefits can be measured with a reasonable degree of precision.
Examples of an asset include Account Receivable (amount of money owed by customers for purchases made on credit), Inventory (the array of finished goods or raw materials with the intention of selling as quickly as possible at a markup), Prepaid Rent.
Liability
A liability is a claim on assets by “creditors” (non-owners) that represents an obligation to make future payment of cash, goods, or services. A liability is recognized when (the criteria is the same as asset):
- The obligation is based on benefits or services received currently or in the past (i.e., transactions);
- The amount and timing of payment is reasonably certain.
Examples of liability include Account Payable (amount of money due to vendors and suppliers), Income Tax Payable, Salary Payable, Debt Principal. Note that the interest becomes liability when the principal is outstanding over time.
Stockholders’ Equity
Stockholders’ equity is the residual claim on assets after settling claims of creditors (= assets - liabilities). It is also called “net worth”, “net assets”, “net book value”.
Sources of Stockholders’ equity include
- Contributed capital (arises from sale of shares)
- Common stock (par value, min value sold at initial offering)
- Additional paid-in-capital (excess over par value)
- Treasury Stock (stock repurchased by company)
- Retained earnings (arises from operations)
- Accumulation of net income (revenues minus expenses), less dividends, since start of business.
Dividends are distributions of retained earnings to shareholders, and they are not an expense (not a cost of generating revenue). They’re recorded as a reduction of retained earnings on the declaration date (creates a liability until payment date).
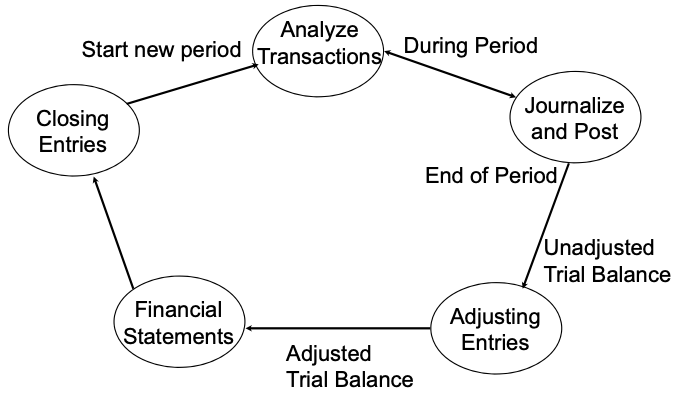
The Accounting Cycle
In every accounting cycle (year or quarter), companies follow the process the record transaction and generate financial statements:
Debit and Credit Bookkeeping
Bookkeeping is the recording of financial transactions in a company. There are three fundamental bookkeeping equations:
\[\text{Assets} = \text{Liabilities}+\text{Stockholders' Liability} \\ \text{Sum of Debits} = \text{Sum of Credits} \\ \text{Beginning account balance} + \text{Prior Increases Earnings} - \text{Decreases} = \text{Ending account balance} \\\]These equations must be in balance at all times! The balance sheet equation can be preserved through the use of “debits” and “credits”. The definitions of Debit and Credit are:
- Debit (Dr.) = Left-side Entry
- Credit (Cr.) = Right-side Entry
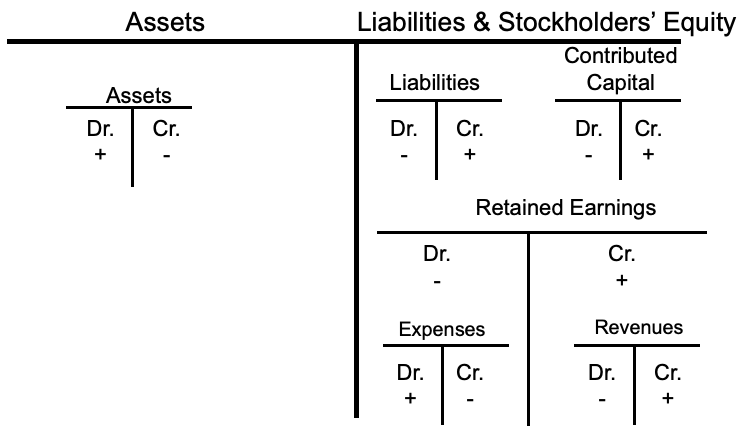
The reason they are called left and right-side entries is from the complete balance sheet equation by moving the negative Expenses to the left side:
\[\underbrace{\text{Assets} + \text{Expenses}}_{Debits} = \underbrace{\text{Liabilities} + \text{Contrib. Capital} + \text{Retained Earnings} + \text{Revenues}}_{Credits}\]Note that dividends is not in the equation. It is treated as changes in retained earnings. Rules of Debits and Credits:
- Every transaction must have at least one debit and at least one credit;
- Debits must equal credits for all transactions;
- No negative numbers are allowed.
Bookkeeping is done via accounts. The T Account is a visual representation of individual accounts that looks like a “T”, with debits listed on the left side of the T and credits listed on the right side of the T, making it so that all additions and subtractions (debits and credits) to the account can be easily tracked and represented visually.
The normal balance of an account is the type of balance (debit or credit) the account carries under normal circumstances. The Account Balance is the difference between sum of debits and sum of credits for the account. Thus, the change in account balance equation:
\[\text{Beginning Balance} + \text{Increases} - \text{Decreases} = \text{Ending Balance}\]Assets and Expenses are Debit accounts (i.e., the normal balance is debit). The account balance increases through debit, and decreases through credit. Beginning (Debit) Balance + Debits - Credits = Ending (Debit) Balance.
Liabilities, Stockholders’ Equity, Revenues are Credit accounts (i.e., the normal balance is credit). The account balance decreases through debit, and increases through credit. Beginning (Credit) Balance + Credits - Debits = Ending (Credit) Balance.
The super T account below shows how accounts balances change.
When transactions are entered into journals, always ask the following three questions:
- Which specific asset, liability, stockholders’ equity, revenue or expense accounts does the transaction affect?
- Does the transaction increase or decrease the affected accounts?
- Should the accounts be debited or credited?
When entering them into journals, always list Debits first and always indent Credits, like this:
Dr. <Name of Account Debited> $XXX
    Cr. <Name of Account Credited> $XXX
Revenues
The Income Statement reports increase in shareholders’ equity due to operations over a period of time. The income statement equation is Net Income = Revenue – Expenses. Net income is also called “earnings” or “net profit”. All income statement items are based on Accrual Accounting principles, which is the accounting recognition of revenues and expenses are tied to business activities, not to cash flows.
- Revenue recognition criteria: Revenues are recognized when goods or services are provided. \(\text{Revenues} \neq \text{Cash inflows}\).
- Matching principle: Expenses are recognized in the same period as the revenues they helped to generate. \(\text{Expenses} \neq \text{Cash outflows}\).
Thus, \(\text{Net income} \neq \text{Net cash flow}\).
Revenue is an increase in shareholders’ equity (not necessarily cash) from providing goods or services. The revenue recognition criteria says that revenue is recognized when both:
- It is earned (i.e. goods or services are provided) and
- It is realized (i.e. payment for goods or services received in cash or something that can be converted to a known amount of cash, e.g., invoices).
Sometimes goods and services are provided over time (not fully earned) so the upfront payment cannot be fully booked at once.
Expenses
Expenses are decreases in shareholders’ equity (not necessarily cash) that arise in the process of generating revenues. Expenses are recognized when either:
- Related revenues are recognized (product costs) or
- Incurred, if difficult to match with revenues (period costs and unusual events)
For manufacturing, product costs are the cost of raw materials, labor, factory, etc., and will stay in inventory until the goods are sold, at which time they become expenses. Thus, product costs follow the product. Period costs are those not directly related to the manufacturing but to running the business, such as R&D, operations, sales and marketing, human resource, and top management. They are SG&A (selling, general and administrative cost).
The underlying recognition concepts are the
- Matching principle (product vs. period costs);
- Conservatism principle (unusual events): recognize anticipated losses immediately, recognize anticipated gains only when realized (anti-human nature to avoid losses).
In most time, revenue of sales comes with expenses of cost of goods sold (COGS) and they book together.
Adjusting Entries
Adjusting entries are internal transactions that update account balances in accordance with accrual accounting prior to the preparation of financial statements.
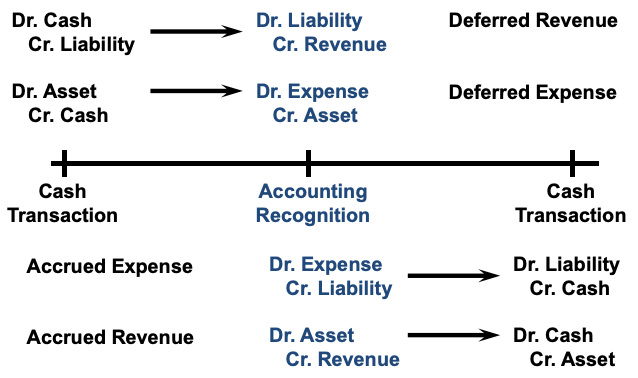
There are two types of adjusting entries:
- Deferred Revenues and Expenses
- Update existing account balances to reflect current accounting values
- Cash flow in past; record revenue/expense now
- Accrued Revenues and Expenses
- Create new account balances to reflect unrecorded assets or liabilities
- Record revenue/expense now; cash flow in future
Deferred Expenses answer the question that “Are there any assets that have been “used up” this period and should be expensed?”. Examples include Prepaid Rent (rent paid in the past but property is used in this period), Prepaid Insurance, Depreciation or amortization. The journal entry includes Dr. Expense and Cr. Prepaid Asset.
Deferred Revenues answers the question that “Are there any liabilities that have been fulfilled by delivery of goods or services that should be recognized as revenue?” This covers the scenario where cash was received before but goods and services are delivered over time. Examples include unearned rental income, deferred subscription revenue. The journal entry includes Dr. Unearned Revenue Liability and Cr. Revenue.
Accrued Expenses answers the question that “Have any expenses accumulated during the period that have not yet been recorded (paid)?” These accounts are all payable type. Examples include Income Taxes Payable, Interest Payable, Salaries and Wages Payable. The journal entry includes Dr. Expense and Cr. Payable Liability.
Accrued Revenue answers the questions that “Have any revenues accumulated during the period that have not yet been recorded (received)?” These accounts are all receivable type. Examples include Interest Receivable, Rent Receivable. The journal entry includes Dr. Receivable Asset and Cr. Revenue.
Note that, although in theory, revenue and expenses should be recorded when the transactions happen. However, for goods and services delivered over time, it is easier to do so at the end of the period versus over time. Adjusting entries are visualized below:
Depreciation and Amortization
The purpose of depreciation and amortization is to allocate the original cost of a long-lived asset over its useful life, so that the total cost of asset matches to the revenues it generates over its period of use. Tangible assets (physical assets) require depreciation and intangible assets (abstract assets) require amortization.
Depreciation is not deducted from the tangible asset account. Rather, it is recorded in a Contra Asset Account (XA, opposite to asset but still part of asset in the balance sheet equation) called Accumulated Depreciation, which has a credit balance and is subtracted from PP&E (property, plant, and equipment) on the balance sheet to get the “Net Book Value”. The journal entry includes Dr. Depreciation Expense and Cr. Accumulated Depreciation.
Amortization is often (but not always) deducted directly from the intangible asset account. There are companies with large amount of intangible asset starting to use accumulated amortization, which works just like depreciation.
Most companies use Straight-line Depreciation, where the Depreciation Expense = (Original Cost – Salvage Value) / Useful Life. Compared to accelerated depreciation, which depreciates faster at earlier years, it produces smoother financial statements.
Financial Statements
After Adjusting Entries are added, we get the adjusted trial balance, which summarizes balances in each account after adjusting entries. It is used to make financial statements.
Prepare Income Statement first. Then, use Net Income to update Retained Earnings and to prepare Balance Sheet. Finally, complete the Statement of Cash Flows and Statement of Stockholders’ Equity.
The Income Statement Format
| Section | Comment |
|---|---|
| Revenue (or Sales) | Revenue from company’s core business |
| Cost of Goods Sold | Product Cost |
| Gross Profit | \(\text{Revenue} - \text{COGS}\), markup in terms of the product cost |
| Operating (SG&A) Expense | Period Cost |
| Operating Income | \(\text{Gross Profit} - \text{SG&A Expense}\), measuring profitability of the core business |
| Interest, Gains, and Losses | Revenues and expenses that don’t come from the core business |
| Pre-tax Income | |
| Income Tax Expense | |
| Net Income | a.k.a. earnings or net income |
Operating Income is the key performance metrics for a company’s core business, and terms “above the line” or “below the line” means above or below the operating income.
The Balance Sheet Format
- Assets
- Current assets (provide benefits within next year), ordered by liquidity (how readily can they be converted to cash):
- Cash
- Accounts Receivable
- Inventory
- Prepaid Assets (never covert to cash, deferred expenses)
- Noncurrent assets
- Tangible assets (property, plant and equipment). Often tangible assets have “Less Accumulated Depreciations” listed below.
- Intangible assets (software, trademarks, and goodwill)
- Current assets (provide benefits within next year), ordered by liquidity (how readily can they be converted to cash):
- Liabilities
- Current liabilities (obligations within next year), ordered by liquidity:
- Bank borrowings
- Accounts payable and other payables
- Deferred revenues and other noncash
- Noncurrent liabilities
- Bank borrowings and bonds
- Other types of liabilities (deferred taxes, pensions)
- Current liabilities (obligations within next year), ordered by liquidity:
- Stockholders’ equity
- Contributed capital
- Retained earnings
Closing Entries
Temporary Accounts accumulate the effects of transactions for a period of time only. Revenue and Expense accounts are temporary accounts and they are closed out to retained earnings at the end of period.
Permanent Accounts accumulate the effects of transactions over the entire life of business. Balance sheet accounts (Assets, Liabilities, Contributed Capital, Retained Earnings) are permanent accounts.
Closing entries are internal transactions that “zero out” temporary accounts at the end of the accounting period. Revenue and Expense account balances are transferred to Retained Earnings.
Revenues:
Dr. Revenue Accounts (-R, -SE)
  Cr. Retained Earnings (+SE)
Expenses:
Dr. Retained Earnings (-SE)
  Cr. Expense Accounts (-E, +SE)
The Post-closing trial balance summarizes balances of permanent accounts after closing entries. All revenue and expense accounts have a zero balance and we are ready to start the next fiscal period.
Statement of Cash Flows
Reports changes in cash due to operating, investing, and financing activities over a period of time (between two balance sheets). The statement of cash flows reports net cash from operating, investing, and financing activities, and the sum of them are the net change in cash balance.
Non-cash transactions are disclosed at the bottom of the statement as “supplemental cash flow information”. Cash interest paid and cash income taxes paid must also be disclosed.
Operating, Investing, and Financing Cash Flows
Operating activities are transactions related to providing goods and services to customers and to paying expenses related to generating revenue (i.e. “income statement” activities). Operating cash outflows exclude these income statement items:
- Depreciation and amortization (and other noncash items)
- Gains or losses on disposal of PP&E
Investing activities are transactions related to acquisition or disposal of long-term assets. The rule of thumb for “long-term” is one year. If an asset is held for less than a year, then gain/loss is operating cash flow.
Financing activities are transactions related to owners or creditors (except for interest payments).
Examples of cash flows are listed below:
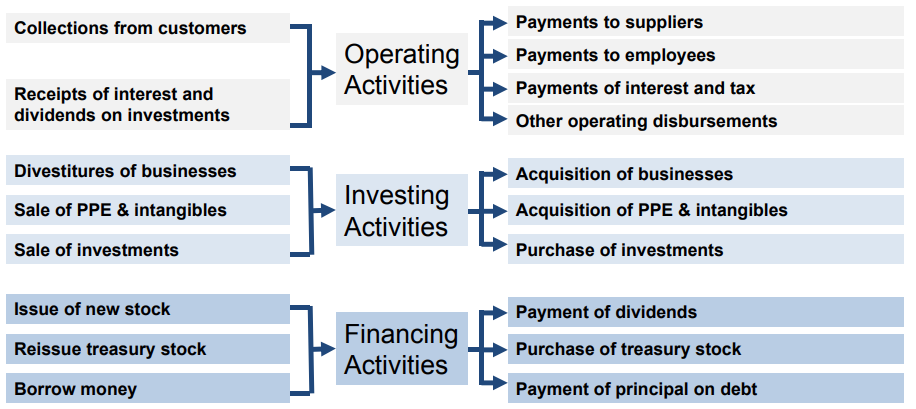
US GAAP categories interest payments as operating activities to match the income statement. Under IFRS, interest and dividends received and paid may be classified as operating, investing, or financing, as long as a company is consistent.
The Statement of Cash Flow for companies in different growth stages are shown below:
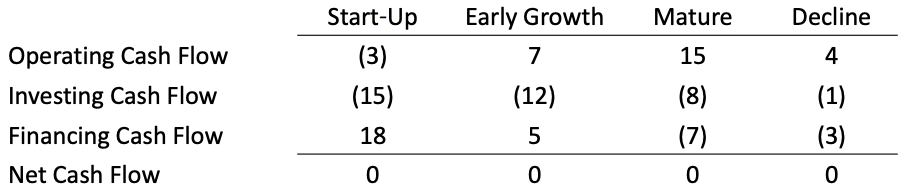
Early start-ups raises cash from financing and have big investing outflows and negative operating cash flows (not yet profitable). Early growth companies has positive operating cash flows but continue to invest and finance. Mature companies have very positive operating cash flow, and start to pay back financing (negative financing cash flow). Declining companies have low operating cash flow.
One useful measure of the investment into the company is to compare the depreciation & amortization with purchase of PP&E. Depreciation and amortization can be roughly treated as “using up PP&E” so the outflow of PP&E. If the purchase of PP&E is greater, it means the company is investing in expanding its production capability.
Methods for Preparing SCF
The direct method lists cash receipts and disbursements by source/use of funds. It is always used for investing and financing activities and rarely used for operating activities.
The indirect method’s goal is to reconcile net income with cash from operations by removing noncash items from net income and including additional cash flows not in net income. It is only used for operating activities.
The workflow of indirect method is as follows:
- Start with Net Income.
- Adjust for components of Net Income tied to noncash items or to investing activities by adding back expenses and subtracting revenues.
- Noncash items are depreciation, amortization.
- Investing activities are Gains/losses on sale of PP&E or investments.
- Adjust for components of Net Income tied to operating assets and liabilities created through operating activities (i.e., working capital):
- Add or subtract change in asset/liability account balance (e.g, inventory, A/P, and A/R)
- Use the balance sheet equation to determine whether to add or subtract: \( \text{Assets}=\text{Liabilities}+\text{Stockholders’ Liability} \).
The reason to use indirect method for operating cash flow is to use net income as a benchmark for “expected” cash flow. Otherwise, direct cash flows of operating activities are hard to understand.
SCF Complications
The change in balance sheet numbers often not equal the number on the SCF for the following reasons:
- Noncash investing and financing activities shown as supplemental disclosure below SCF;
- Acquisitions and divestitures of businesses. These are investing activities that affect balances in operating asset and liability accounts
- Foreign Currency Translation Adjustments. Changes in cash due to exchange rate movements shown separately from the operating cash flow (often in the bottom of SCF).
- Subsidiaries in different industries (e.g. real estate). Some transactions (e.g. buying land) are investing activities in one part of business and operating in another.
EBITDA, Earnings, and Cash Flows
EBITDA (Earnings before interest, taxes, depreciation, and amortization) is often used as a proxy for cash flow that excludes interest and taxes. However, EBITDA does not measure cash flow well if there are large changes in working capital (e.g., A/R) and suffers from the same manipulation potential as net income (e.g., shipping goods before ordering to generate A/R). Therefore, some times people removes certain items from EBITDA as a better measure of cash flow.
Research finds that earning (a.k.a net income) are a better predictor of future cash flow than current Cash Flow from Operations.
Free Cash Flow
Free cash flow is operating cash flow minus cash for long-term investments. However, there is no standard measure for operating cash flow. Companies often disclose free cash flow using their own custom definition that may vary company-to-company and year-over-year.
Ratio Analysis
Ratios are useful in assessing profitability, liquidity, and risk. It can highlight sources of competitive advantage and “red flag” of potential trouble.
Ratios must be compared to a benchmark
- Compare same firm across time (time-series analysis)
- Compare firm to other firms or to industry (cross-sectional analysis)
Ratios are contextual. Ratio analysis does not provide answers, but instead helps you ask better questions. You should try to determine the underlying activity that the ratio represents to determine whether it is good or bad news.
Note that, ratios can be misused.
- Standard ratios have multiple definitions. There is no GAAP for ratio definitions. You should use the same definition to make valid comparisons.
- Choosing the appropriate benchmark for comparison is important. Major changes in the firm (M&A) distort time-series analysis, and differences in business strategy, capital structure, or business segments distort cross-sectional analysis. Differences in accounting methods make all comparisons difficult.
- Ratios may be manipulated by managerial action. It is hard to manipulate all ratios so we should compare the body of ratios versus a single one.
Return on Equity (ROE)
Whether Net Income is good or bad depends on the level of investment required.
\[\text{ROE}=\text{Net Income}/\text{Average Shareholders' Equity}\]It measures Return on Investment (ROI), which should increase with the risk of the company. The numerator represents how much return the company generated for shareholders during the year based on accrual accounting, and the denominator represents the shareholders’ investment in the company. Because Shareholders’ Equity is point-in-time, you must take average of beginning and ending balances.
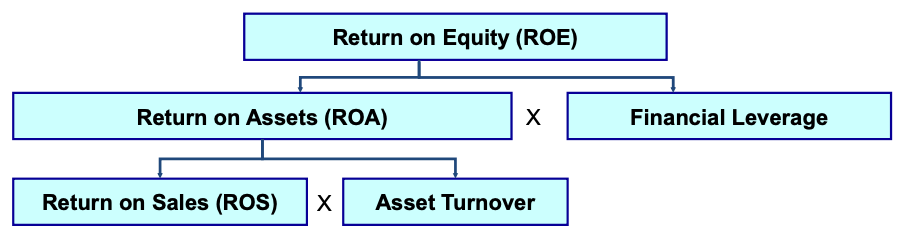
ROE has two drivers:
\[\text{ROE}=\underbrace{\text{Net Income}/\text{Average Assets}}_{\text{Return on Assets}} \times \underbrace{\text{Average Assets}/\text{Average Shareholders' Equity}}_{\text{Financial Leverage}}\]Return on Assets (\(\text{ROA}=\text{Net Income}/\text{Average Assets}\)) represents the effectiveness managers use company resources (assets) to generate profits, i.e., the operating performance.
Financial leverage measures how much the managers use debt to increase available assets for a given level of shareholder investment. Note that financial leverage is different from many “leverage” ratios you hear about (e.g., debt-to-equity).
Return on Assets (ROA)
Ideally, ROA would measure operating performance independent of the company’s financing decisions. But, the numerator of ROA, Net Income, includes Interest Expense. It means more leverage, higher Interest Expense, and thus lower Net Income.
To truly remove all financing effects from ROA, we must de-lever Net Income. Thus
\[\text{ROA} = \text{De-Levered Net Income} / \text{Avg. Assets}\]and
\[\text{De-levered Net Income} = \text{Net Income} + (1-t) \times \text{Interest Expense}\]\(t\) is the marginal tax rate. We add after-tax Interest Expense back because it is income-tax deductible.
ROA has two drivers, too:
\[\text{ROA} = \underbrace{\text{Net Income} / \text{Sale}}_{\text{Return on Sales}} \times \underbrace{\text{Sales} / \text{Avg. Assets}}_{\text{Asset Turnover}}\]Return on Sales (\(\text{ROS}=\text{Net Income}/\text{Sales}\)) measures how much profit the company earns on each dollar of sales, i.e., profitability.
Asset Turnover (\(\text{ATO}=\text{Sales}/\text{Avg. Assets}\)) measures how much sales the company generates based on its available resources, i.e., efficiency.
DuPont Ratio Analysis Framework
For example, discount retailers generate high ROE by efficiency and low profitability, and luxury retailers do so by high profitability and low efficiency.
Profit Margin Ratios
To determine the drivers of profitability, we can look at the following ratios, most of which can be found on the Common Size Income Statement.
- \( \text{Gross Margin} = (\text{Sales} - \text{Cost of Goods Sold}) / \text{Sales} \)
- \( \text{SG&A-to-Sales} = \text{SG&A Expense} / \text{Sales} \)
- \( \text{Operating Margin} = \text{Operating Income} / \text{Sales} \)
- \( \text{Interest Expense-to-Sales} = \text{Interest Expense} / \text{Sales} \)
- \( \text{Effective Tax Rate} = \text{Income Taxes} / \text{Pre-tax Income} \)
Asset Turnover Ratios
Asset Turnover Ratios help to understand how each component in asset change over time.
- \( \text{Accounts Receivable Turnover} = \text{Sales} / \text{Average A/R} \)
- \( \text{Inventory Turnover} = \text{Cost of Goods Sold} / \text{Average Inventory} \)
- \( \text{Accounts Payable Turnover} = \text{Purchases} / \text{Average Accounts Payable} \)
- \( \text{Purchases} =\text{ Ending Inventory} + \text{COGS} – \text{Beginning Inventory} \)
- \( \text{Fixed Asset Turnover} = \text{Sales} / \text{Avg. Net PP&E} \)
However, these ratios are not intuitive. We often convert them into days outstanding ratios that shows how many days, on average, accounts are outstanding. For example, Days Inventory of 45 means that it takes 45 days, on average, from the time we start building Inventory until we sell it.
- \( \text{Days Receivable (Sales) Outstanding} = 365 / \text{A/R Turnover} \)
- \( \text{Days Inventory} = 365 / \text{Inventory Turnover} \)
- \( \text{Days Payable} = 365 / \text{A/P Turnover} \)
\( \text{Net Trade Cycle} = \text{Days Receivable} + \text{Days Inventory} - \text{Days Payable} \) represents the gap between cash outflows and cash inflows that we have to bridge with short-term borrowing.
Common Size Financial Statements
It is hard to spot trends in the financial statements because of growth. Growth in Assets and Sales drive trends in all of the line items. Thus, to answer the question that “are certain line items growing more or less than would be expected given the growth in assets or sales”, we can normalize financial statements.
- Balance sheet: express all numbers as a percent of Total Assets
- Income statement: express all numbers as a percent of Sales
- Cash flow statement: typically not common sized
Liquidity Ratios
We want to determine the debt level of a company and whether the company can generate enough cash to meet its liability. It can be divided into short-term and long-term, and short-term can be further divided into liquidity and interest ratios.
Short-Term Liquidity Ratios
It determines whether the company have enough cash coming in to cover obligations to pay out cash. Ideally, these ratios would be over 1.
- \(\text{Current Ratio} = \text{Current Assets} / \text{Current Liabilities}\)
- Some assets may not be able to convert to cash easily (e.g., Prepaid Rent or Inventory). \(\text{Quick Ratio} = (\text{Cash} + \text{Receivables}) / \text{Current Liabilities}\) only looks at cash and A/R.
- \(\text{CFO to Current Liabilities} = \text{Cash from Operations} / \text{Avg. Current Liabilities}\). The one is more backward-looking.
Interest Coverage Ratios
It determines whether the company have enough cash coming in from operations to cover interest obligations. Ideally, ratios would be over 1.
- \( \text{Interest Coverage = (Operating Income before Depreciation) / Interest Expense}\)
- \( \text{Cash Interest Coverage = (Cash from Operations + Cash Interest Paid + Cash Taxes) / Cash Interest Paid}\)
Long Term Debt Ratios
It shows how the company finances its growth.
- \( \text{Debt to Equity} = \text{Total Liabilities} / \text{Shareholders’ Equity}\). Total Assets is sometimes used in the denominator.
- \( \text{Long-Term-Debt to Equity} = \text{Total Long-Term Debt} / \text{Total Stockholders’ Equity}\).
- \( \text{Long-Term Debt to Tangible Assets} = \text{Total Long-Term Debt} / (\text{Total Assets} - \text{Intangible Assets)}\).